Propinquity is inspired by the idea that the proximity of different social groups is important for society to function well but that we do not have a good understanding of social distance in cities around the world. In this web-based platform, scholars and students can compare cities to better understand how people come together and cities co-exist in an inter-connected world.
Cities and their residents depend on each other every day, and will need to do so even more if they are to adapt to the challenges of an accelerating climate crisis. Learning from each other and developing approaches that ensure all residents are included is a first step before action. The ways that cities overcome the divisions embedded in their built and social environment will be central to achieving the goals of mitigation and adaptation.
This project aims to provide tools to facilitate learning through comparison and collaboration.
INCOME SEGREGATION
Segregation is the spatial concentration of groups (by income, race and ethnicity, or other grouping) that enables the unequal access to resources. In many countries, contemporary segregation patterns are the combination of decades of discriminatory institutions that established general spatial patterns and the reproduction of inter-group inequalities that resulted from discrimination. The two work hand-in-hand. The spatial concentration of Black Americans or South Africans, for example, was used to deny them access to education, healthcare, and economic opportunities. Even after the removal of laws that created these disparities, the gaps were so wide and the programs to reduce inequality too timid to reverse the patterns.
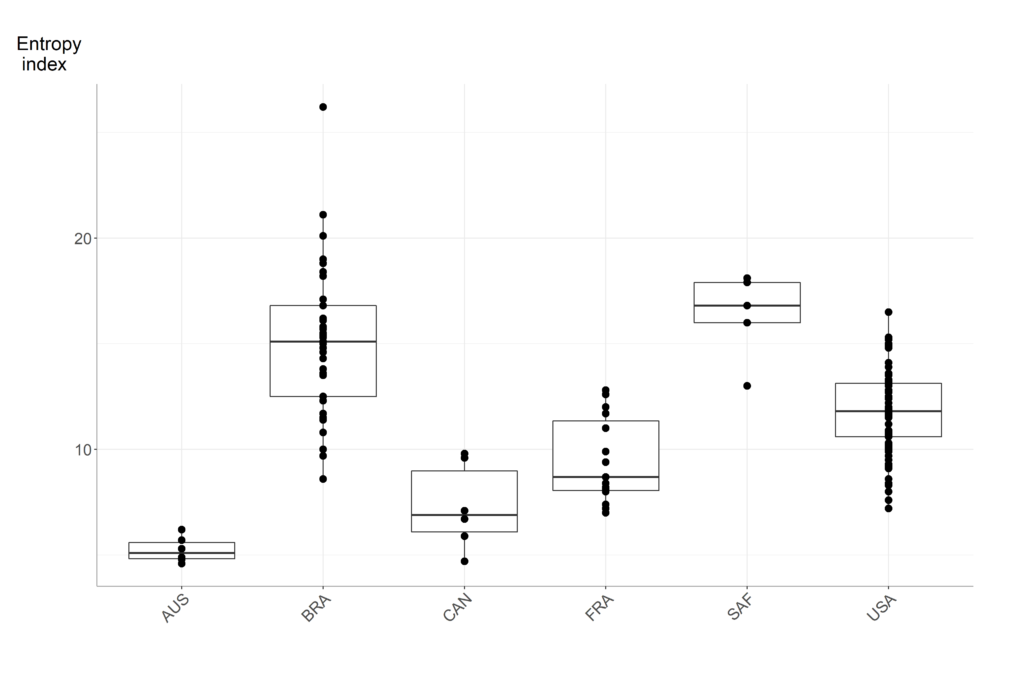
The plot to the left shows how much variation there is in levels of segregation within and between countries. The ordinal index is a measure of segregation that compares how closely the distribution of income categories match the overall distribution of the city. In other words, in a city with three income categories – low, medium, high – where each category is one third of the population, if every neighborhood has the same composition segregation would be zero. If every neighborhood had only one group represented, then segregation would be complete, equal to 1.
Large-Scale Segregation
While segregation focuses on smaller scale separations, many cities are divided into large sectors that are relatively high or low income. This is consequential because it reinforces the effects of segregation. For example, a city that is highly segregated at the neighborhood level may mitigate the effects by having low income and high income neighborhoods evenly interspersed. In other words, a person living in a lower income neighborhood would never be far from some of the services that tend to concentrate in higher income neighborhoods (like grocery stores and financial services). In contrast, if segregated neighborhoods are embedded into large areas that are also segregated, this exacerbates the spatial disparities segregation causes.
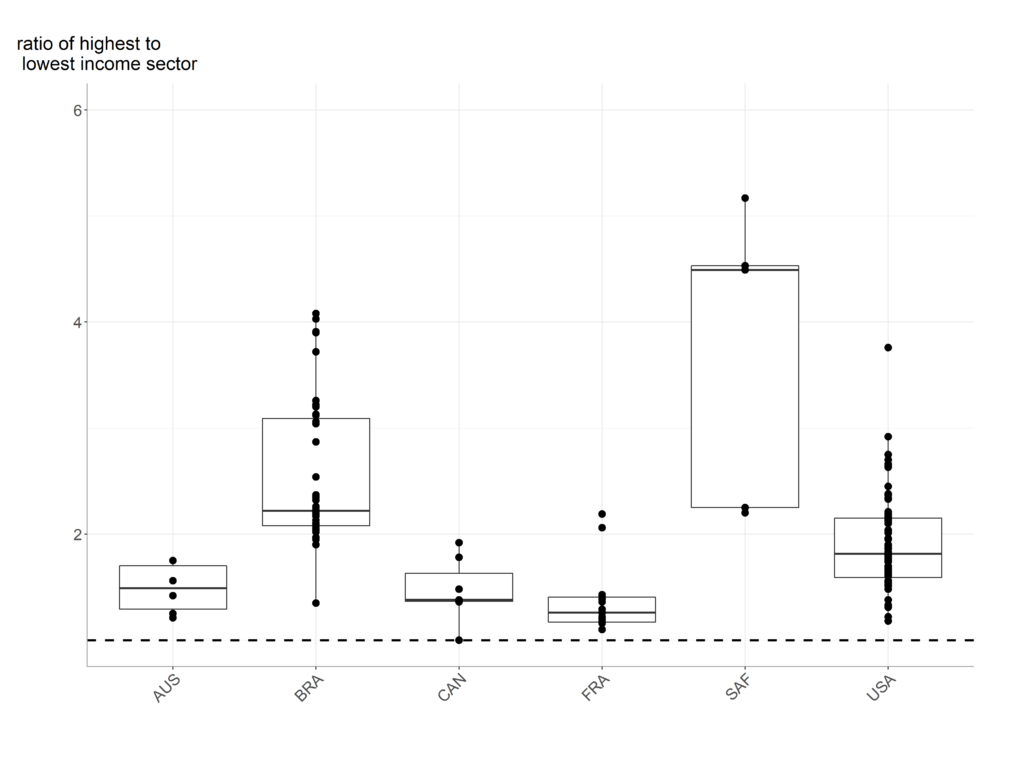
The plot to the left shows the ratio of the highest median income sector to the lowest income sector. Sectors, in this case, are defined broadly. Every city was divided into eight major quadrants (e.g. north east) which were then divided into four sectors with approximately equal population, a total of 32 sectors, each with about 3% of the city’s population. The median income of each sector was estimated and the ratio of the highest to lowest calculated for each city. The clearest pattern is between higher inequality countries (Brazil, South Africa, United States) and the rest. Most cities in Australia, Canada, and France have a ratio between 1 and 2, meaning that the highest income sector has income up to twice as high as the lowest. In contrast, most cities in high inequality countries, have ratios above 2 and as high as 5.
Income and density
The relationship between income and density significantly affects how a city grows. Cities with dense lower income cores may be reluctant to introduce higher density in outlying areas lest it depreciates home values. Dense and wealthy neighborhoods make it difficult to add capacity as land values are too high to make affordable housing economically feasible. As an increasing number of cities reach their land capacity, urban planners have wrestled not only with how to add housing capacity, but adding where it brings the greatest benefit to current and future residents.
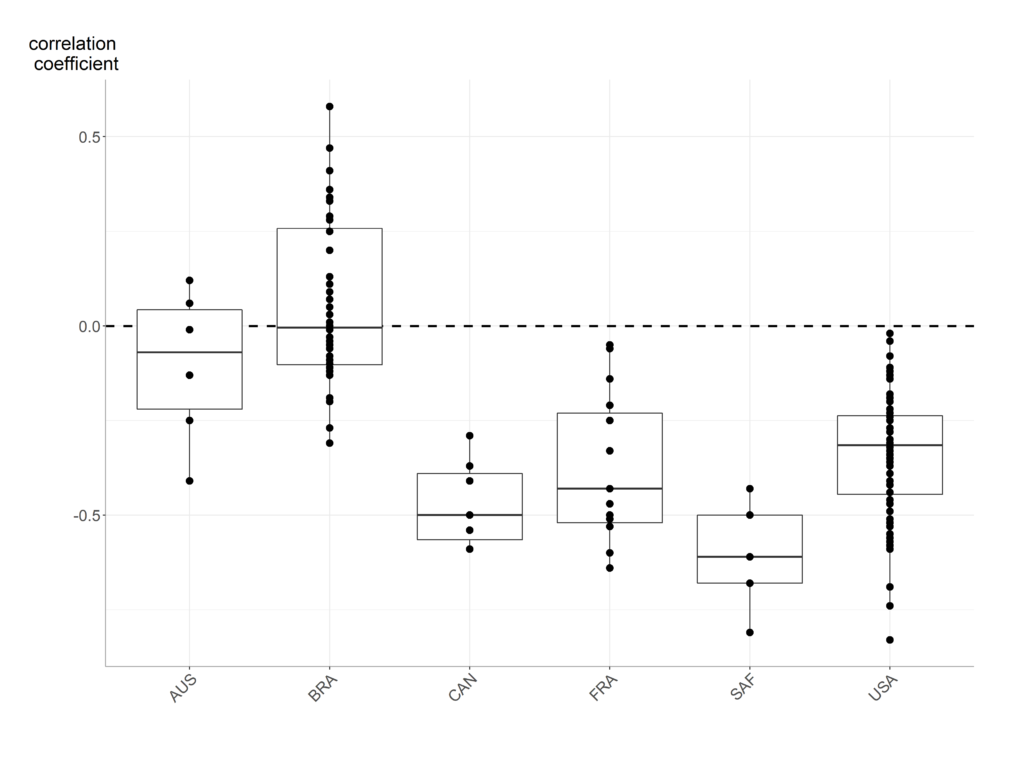
The plot to the left shows the relationship between density and income for all cities in the sample. In most countries, higher density is associated with lower incomes. The clearest exception is Brazil where the highest density neighborhood tend to have higher income. Despite a tendency toward a negative relationship between income and density, there is substantial variation within countries. France and Australia have cities where the relationship is either neutral or positive. The United States shows that in a country with a large and diverse urban system, a wide spectrum of relationships exists. Only South African and Canada have more consistent relationship. In those countries, incomes are highest in the lowest density urban areas.


